Votes as Social Judgement
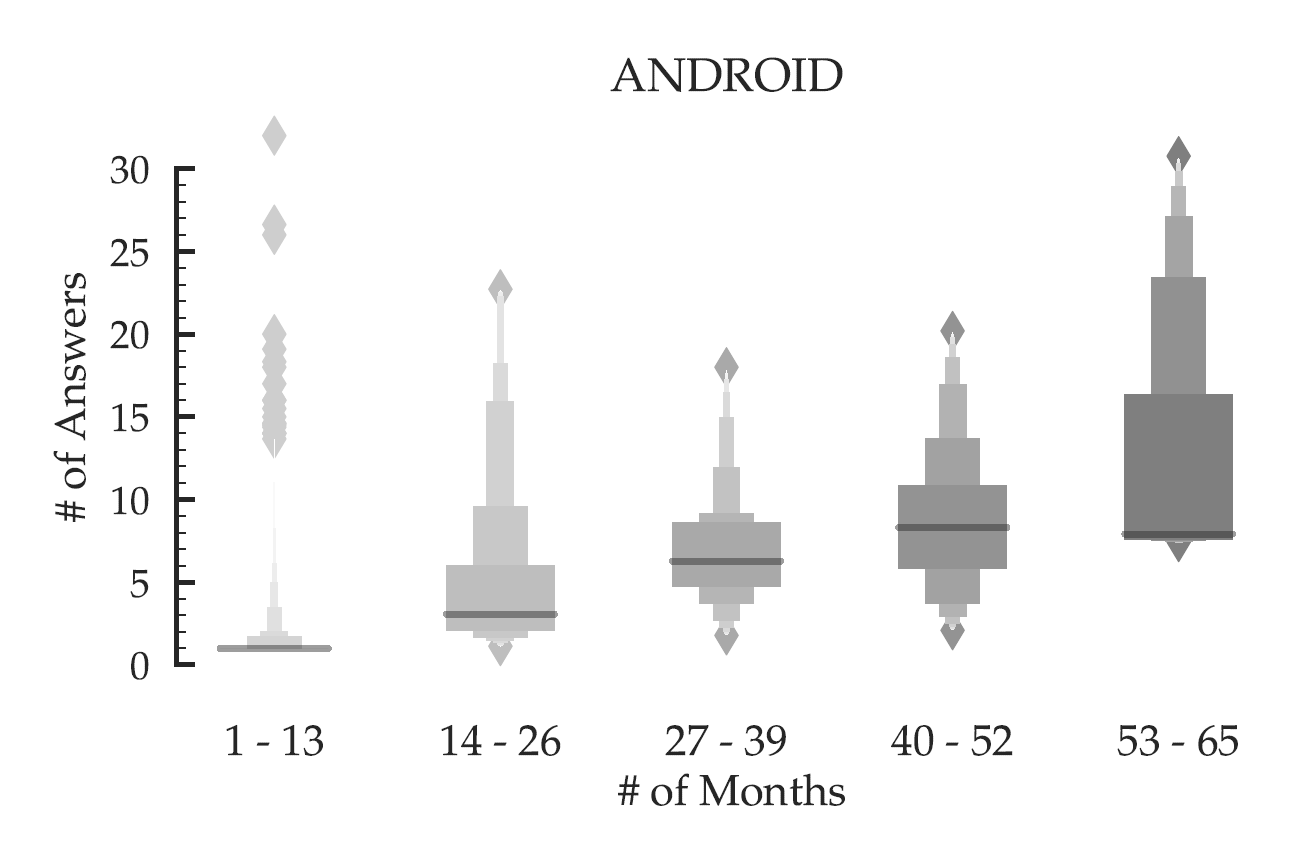
The premise of this research (CSCW 2019) was set up by our previous work (WWW 2018), where we discovered that users who join a Stack Exchange site more recently contribute fewer answers per month compared to those who joined at an early stage (Figure 1). Furthermore, the gap between the participation of old users and newcomers increases significantly as the community grows in terms of the number of users. This empirical phenomenon naturally raises the question: is there any discrepancy between the motivation and perhaps the incentives of old users and newcomers?
While presenting our work at WWW 2018, we came across several blog posts and discussions on social media, where people claimed that online platforms like Stack Exchange are not welcoming to newcomers. A particular blog post stood out amongst these, where Stack Exchange officials acknowledged the problem of newcomers experiencing Stack Overflow to be an unwelcoming place. Such strong qualitative evidence made us wonder if there are systematic biases in how these communities treat newcomers.
Could it be that what is causing the newcomers to give up, is not the poor quality of their content, but the biased social judgment of their peers?
In the present work, we examine biases in social judgment, specifically in the form of votes. We concentrate on votes because they are the primary social feedback in content-based platforms, such as Stack Exchange, Reddit, and Quora. Votes are crucial as not only they form the basis of most platform’s ranking and recommendation services, but also their rewarding policies. The latter has a profound impact on the retention of users.
Motivated by such powerful implications of votes, we ask the following questions:
- What are the factors that affect votes on content?
- Which of these factors may lead to biases?
- What is the degree to which the biasing factors affect the votes on content?
Our goal is to answer these causal questions in an observational setup. Estimating causal effects from observational data is exceptionally challenging. There may be unobserved confounders that explain the association between the biasing factors and the observed votes.
Quantifying Voter Biases
Now that we have introduced our research questions and the main challenge, let’s inspect the factors that may affect votes. Burghardt et al. suggests a number of factors that may affect votes on content. Some usual suspects include:
- Content topic describes what the content is about;
- Content quality refers to what the voter assesses the quality of the content to be;
- Presentation order captures the position of the content in a list-style webpage;
- Social influence in terms of prior votes as seen by the voter;
- Author reputation reflects the online reputation of the user who created the content.
Among these five factors, the first two factors (content topic and content quality) are properties of the content. The remaining factors (presentation order, social influence, and author reputation) are impression signals that appear in the user interface and act as sources of biases. We will now inspect these impression signals for a real-world platform and discuss how they may induce biases.
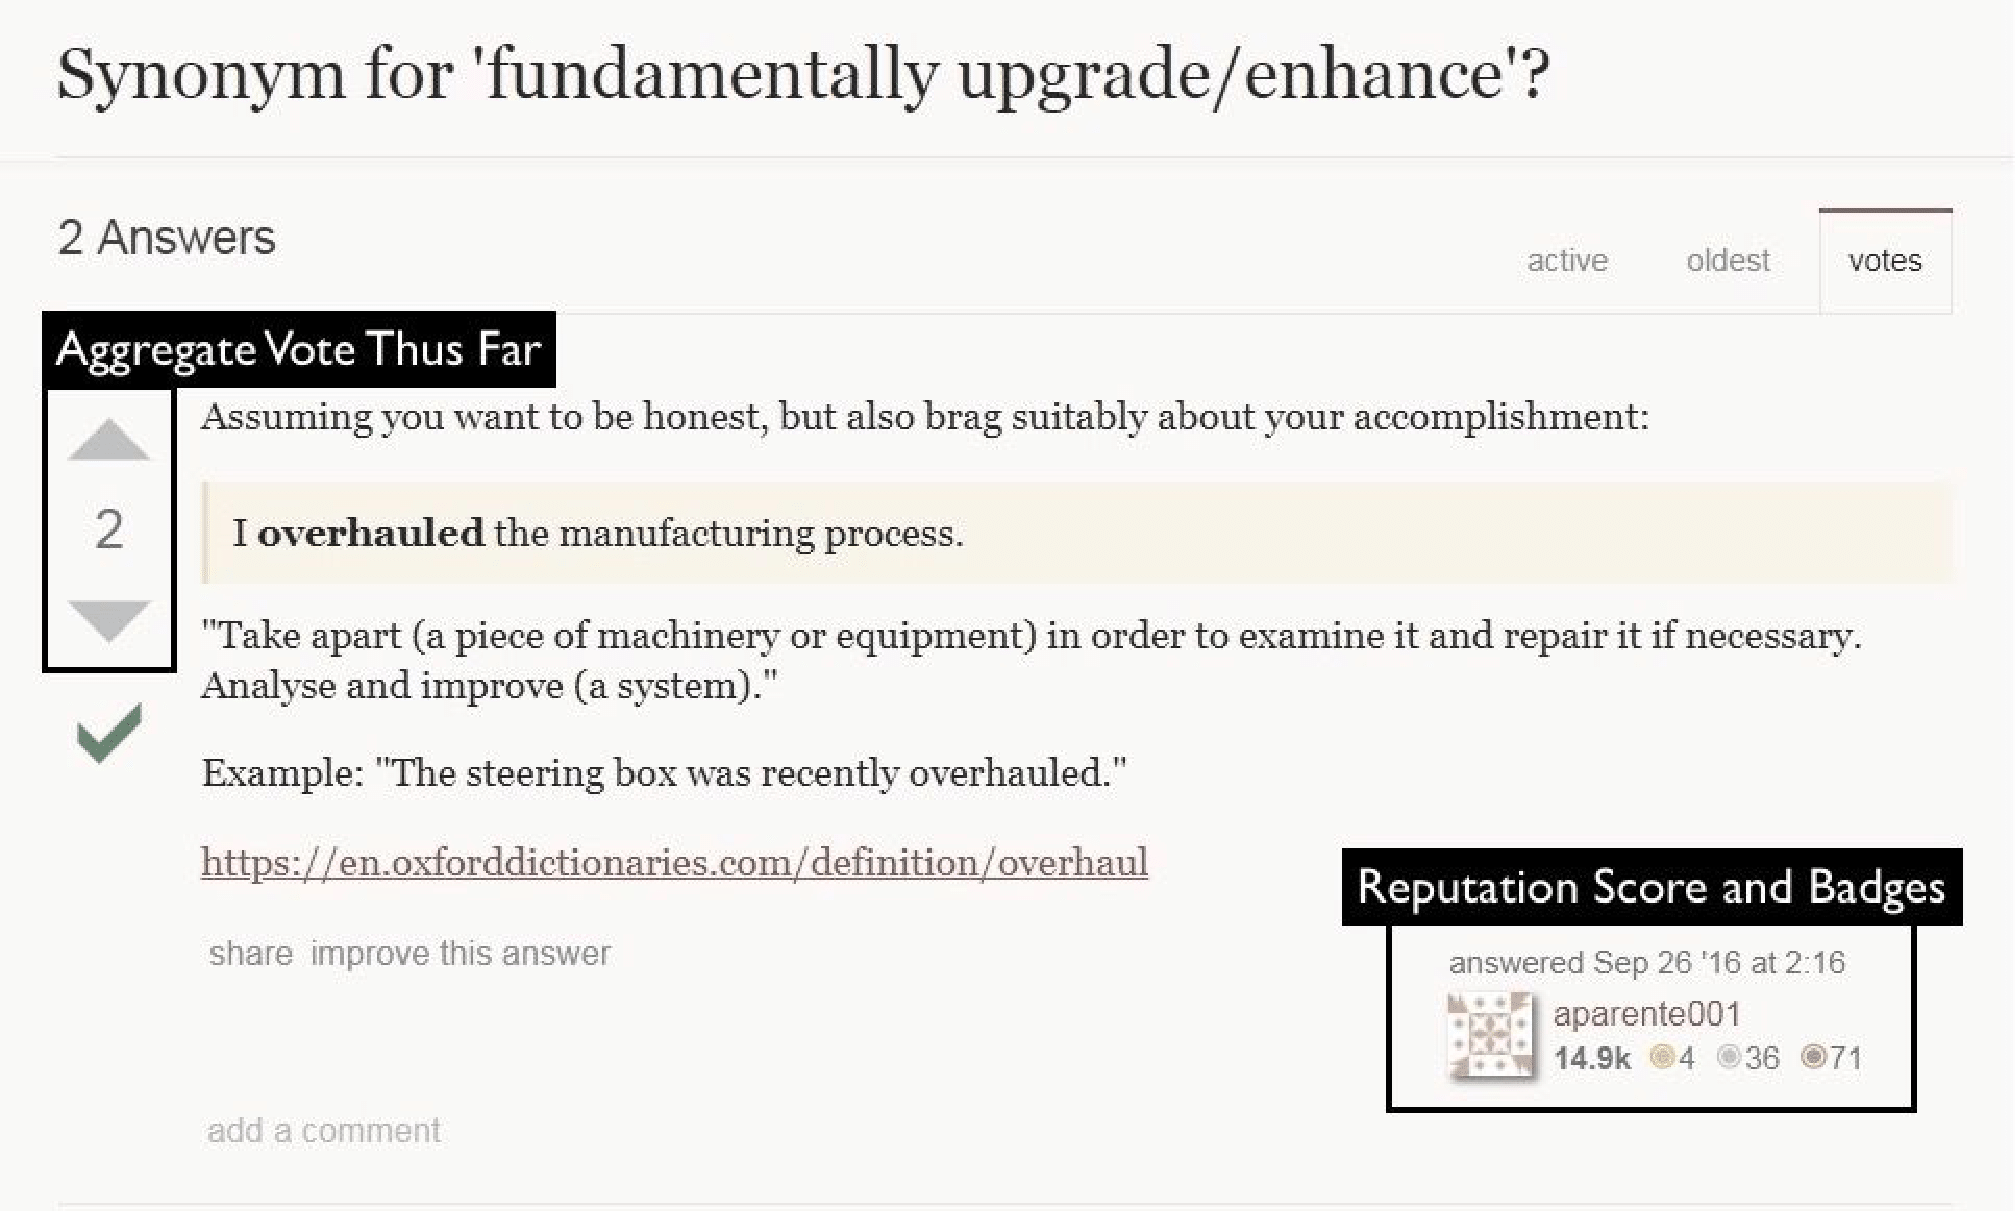
For the purpose of this study, we concentrate on Stack Exchange. In Figure 2, we present a sample page from a Stack Exchange site, annotated with different impression signals that may induce voter biases. In Stack Exchange sites, the answers to any given question appear in some specific order on a page. The position of an answer plays a critical role in deciding how many users will pay attention to it and vote on it. Further, the user interface shows the prior votes on the answer which may act as a social signal to influence voters. In addition, the interface shows the reputation of the answerer in terms of reputation score and badges, which may further affect voters. Similar impression signals appear in other content-based platforms such as Reddit and Quora.
While impression signals are widespread in online platforms, the presence of these signals may contribute to voter biases. Specifically, prior research (Burghardt et al., Hogg et al.) shows that voters tend to use different impression signals as input to make quick decisions about the quality of content. Such use of impression signals as shortcuts to make voting decisions undermines independent assessment and results in biases. We designate these biases as voter biases, which stem from the use of impression signals by voters.
Our goal is to quantify, in an observational setting, the degree of voter biases in online platforms.
What are the causal effects of different impression signals—such as the reputation of the contributing user, aggregate vote thus far, and position of content—on the observed votes on content?
At this point, we position our work in light of related work. There is a rich body of literature on voter biases (notably, Salganik et al., Muchnik et al., Hogg et al.). Broadly, prior work either rely on randomized experiments or statistical models to detect and quantify biases. While the former can help us identify causal effects, a randomized experiment is not an option for researchers who work outside the social media platform with observational data. Statistical models help us identify correlation, not causation. In contrast to the prior works, we quantify biases in an observational setup, which is a significant leap in bias quantification.
The main challenge in our observational setup arises in the form of confounders: factors that may explain the association between the impression signals and observed votes. There are two types of confounders. Observed confounder such as the topic of the content, which can be controlled for and therefore eliminated in an observational setup, and unobserved confounder such as the quality of content which can not be eliminated trivially in an observational setup. The presence of unobserved confounders makes the problem of bias quantification fundamentally challenging.
Instrumental Variable (IV) Method
The instrumental variable (IV) method is a causal inference technique that enables a researcher to quantify causal effects from observational data. The IV method has been successfully used in social sciences, even in the presence of unobserved confounders, e.g., how education affects earnings, how campaign spending affects senate selection, and how income inequality affects corruption. The method first requires identifying candidate instruments that are correlated with the independent variable of interest. It then relies on careful argumentation (thought experiments) to eliminate all candidate instruments that may be affected by the unobserved confounders. This implies that the remaining candidate instruments co-vary only with the independent variable, and cannot influence the dependent variable through an unobserved confounder. These valid instruments allow us to estimate causal effect.
The key conceptual difference between IV and a purely statistical method such as ordinary least squares (OLS): IV relies on argumentation to identify instruments, and thus determine the causal effect of the independent variable, and is not an application of a statistical test on observational data. If all we have access to is observational data, then careful argumentation is necessary to ensure the identification of causal factors. If we were running the actual platform, then we could conduct randomized control trials to identify causal factors (this is what Facebook or Twitter may do), but most researchers have access only to the observational data, and cannot run randomized control trials on the platform. This fundamental limitation motivates us to investigate whether we could use the IV method for quantifying voter biases.
Figure 3 depicts the general structure of an IV model. Designing an IV model requires identifying a valid instrument that must satisfy the following requirements:
- Relevance condition requires that the instrument Z is correlated with the exposure X.
- Exclusion restriction requires that the instrument Z does not affect the outcome Y, except through its potential effect on the exposure X.
- Marginal exchangeability requires that the instrument Z and the outcome Y do not share causes.
IV Model for Reputation Bias
We first explore the instrumental variable method for quantifying reputation bias (Figure 4). Our goal is to estimate how Alice’s current reputation affects the number of votes on her recent answer. The confounder, in this case, is the unobserved quality of Alice’s answer that may affect both her current reputation and the votes she received on the recent answer. We need an instrument to eliminate this unobserved confounder.
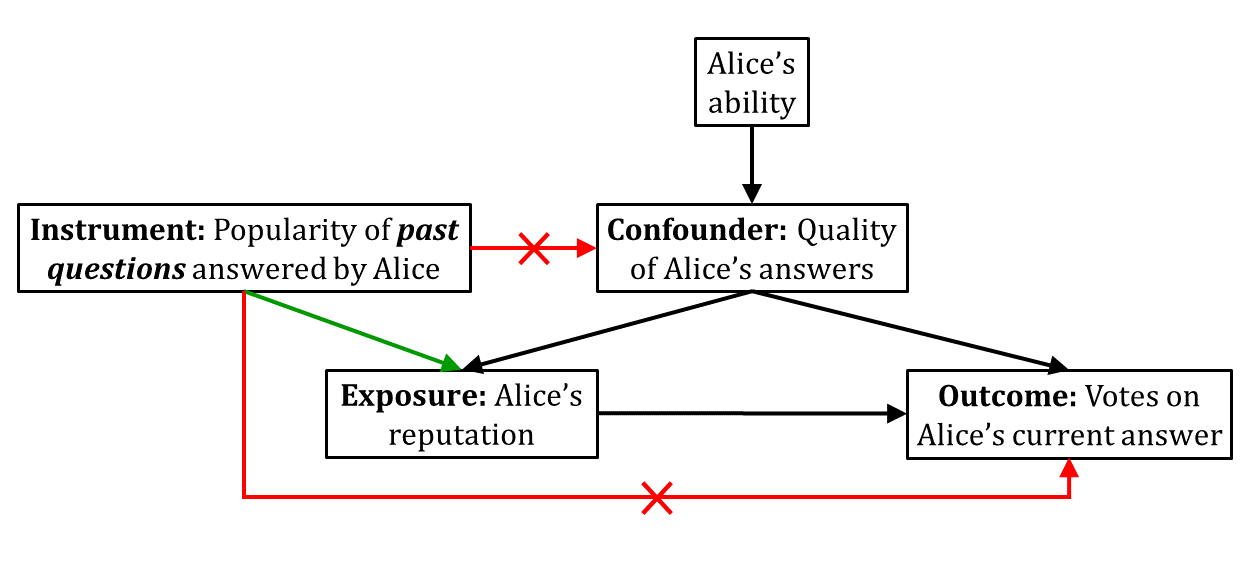
We adopt the popularity of past questions answered by Alice as a candidate instrument to quantify reputation bias. The popularity of past questions answered by Alice contributes to the votes she received on those answers, which in turn affects her current reputation, thus satisfying the relevance condition. Now, the popularity of past questions answered by Alice does not directly affect the votes on her current answer. Also, it does not inform us about the quality of Alice’s past answers. Altogether, our candidate instrument satisfies the exclusion restriction. Finally, as the popularity of questions is not affected by any other variable in our system, our candidate instrument also satisfies marginal exchangeability. Therefore, our candidate instrument is valid for the purpose of reputation bias quantification.
IV Model for Social Influence Bias and Position Bias
We now explore the instrumental variable method for quantifying social influence bias and position bias (Figure 5). Our goal is to estimate how the number of votes Bob received on his answer in the first few hours affects the number of votes he received in the subsequent hours. The confounder, in this case, is the unobserved quality of Bob’s answer that may affect both the initial votes and the subsequent votes on his answer. We need an instrument to eliminate this unobserved confounder.
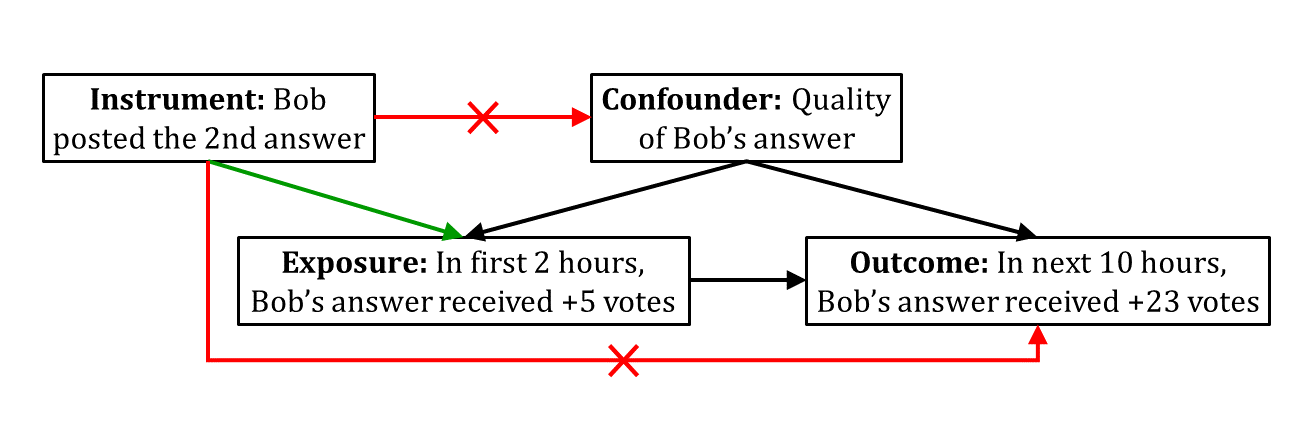
We adopt the timeliness of Bob’s answer as a candidate instrument to quantify social influence bias and position bias. The timeliness of Bob’s answer contributes to the initial votes he received on his answer, thus satisfying the relevance condition. Now, the timeliness of Bob’s answer does not directly affect the subsequent votes. Also, it does not inform us about the quality of Bob’s answer. Altogether, our candidate instrument satisfies the exclusion restriction. Finally, as the timeliness of Bob’s answer is not affected by any variable in our system, our candidate instrument also satisfies the marginal exchangeability. Therefore, our candidate instrument is valid for the purpose of social influence bias and position bias quantification.
Results: OLS vs IV
Now that we have identified valid instruments, how to use these instruments to quantify voter biases? The mathematical formalism is known as two-stage least squares (2SLS) estimation, where we first regress the exposure using the instrument and then regress the outcome using the estimated exposure. The regression coefficients from the second stage provide us unbiased quantification of voter biases.
Now, let’s compare the bias estimates from OLS and IV. The two approaches provide correlational and causal estimates of voter biases respectively.
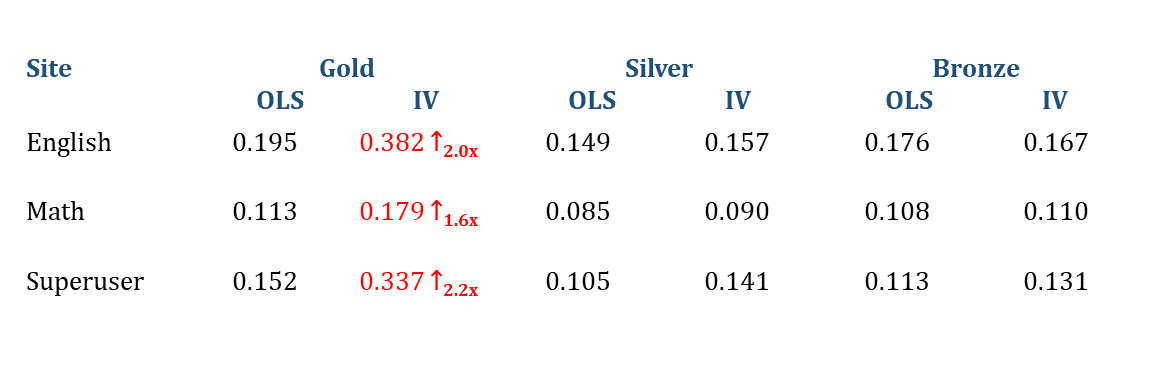
The results in Table 1 show how different types of badges—a form of author reputation—affect votes. We observe that OLS tends to assign equal weights to all badges, IV assigns more weight to gold badges (almost 2x compared to OLS). This finding implies that badges have a significant influence on votes, at times twice as much as the effect suggested by the existing OLS approach.
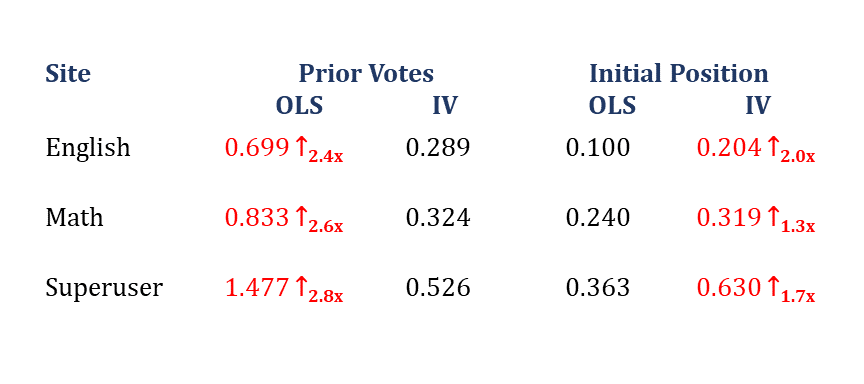
The results in Table 2 show how initial votes and position affect the subsequent votes. We observe that OLS assigns a high weight to prior votes, whereas IV assigns a high weight to the initial position. This finding implies that OLS overestimates social influence bias whereas underestimates position bias significantly.
Implications
In the presented work, we quantify the degree of voter biases in online platforms. Our findings have implications for studying online voting behavior, making changes to the platforms’ interface, changes to the policy, and broader research within the CSCW community. First, there are practical implications. Impression signals (answer position, user reputation, prior votes) play a significant role in influencing an individual’s vote, at times twice as much as previously understood. Second, our work has implications on the future interface design of content-based platforms. For example, these platforms may conceal impression signals prior to the vote, or delay the vote itself to address social influence bias. Future research is needed, however, to understand the effect of these suggestions. Third, our work informs policy. By identifying causal factors, our work offers social media platforms a way to transparently de-bias votes. Finally, by introducing the instrumental variable approach to the CSCW community, we hope that more researchers will adopt it to study other questions of interest: e.g., gender and racial bias online.
Resources
Paper: Quantifying Voter Biases in Online Platforms: An Instrumental Variable Approach
Data and Code: GitHub Repository
@article{dev2019iv,
  author = {Dev, Himel and Karahalios, Karrie and Sundaram, Hari},
  title = {Quantifying Voter Biases in Online Platforms: An Instrumental Variable Approach},
  journal={Proceedings of the ACM on Human-Computer Interaction},
  volume={3},
  number={CSCW},
  year={2019},
  publisher={ACM New York, NY, USA}
}